Manufacturing Data Collection (MDC) and Monitoring
CIMCO MDC-Max is the complete MDC solution that enables automatic collection of manufacturing data from machines and personnel in real-time. MDC-Max provides accurate data for identifying causes of production loss, potential areas of improvement and enables real-time monitoring of your shop floor for continuous improvement.
Generate reports and charts with automatic calculation of OEE, cycle time, idle time, setup time, downtime and more. MDC-Max features real-time machine monitoring with Live Screens and has a fully customizable Operator interface for entering downtime reasons directly at the machine.
MDC-Max can benefit the one man operation with a few machines and the corporate enterprise with multiple factories. The MDC-Max software is highly flexible and easily customized to fit your current and future data collection needs. Since MDC-Max is a networked solution that stores data on a central server you can monitor production from multiple locations and access the data from anywhere.
BENEFITS

Improved efficiency
Understand the performance of equipment and personnel with accurate real-time data collection. Identify causes of production loss and potential areas of improvement for better utilization of resources and data-driven process adjustments.

Accurate data collection
Eliminate manual, time consuming and often inaccurate data collection by automating and streamlining the data collection process.

Real-time monitoring
Monitor and visualize the performance of equipment and personnel to improve response times, identify potential errors early, and improve overall company communication. Improve operator engagement through data-driven awareness.

Real-time and historic reports
Eliminate guesswork. Understand the inner workings of your production with customized real-time and historic reports including machine downtime, OEE and other essential KPIs.

Reduce administration time
Reduce paper reliance and administrative time. Update your ERP, MES or other administrative system directly with real-time data as it is received from equipment and personnel.
Access your data anywhere
Access data from one or more sites directly from your mobile device. Easily check the status of equipment or any other information critical to your operation.
FEATURES
SYSTEM COMPONENTS
MDC-Max is a highly scalable solution that can benefit both small shops and corporate enterprises with thousands of machines in multiple remote facilities. System components include Server, PC client and Web Client which can run on a single PC or, for enterprise requirements, be distributed on multiple servers with an unlimited number of PCs and Web Clients connected.
Robust and reliable server application which operates a fast SQL database (or Microsoft SQL). Does all the heavy lifting in the background such as processing incomming data, updating reports, communicating with external systems and distributing monitoring data to Dashboards, Live Screens, Operator Screens, etc.
Windows-based client application that provides the main interface for configuring the MDC-Max system. The PC client is also used to display Timelines, Live Screens, Operator Screens and includes advanced reporting features.
Modern browser-based client that works on any (modern) mobile device such as a tablet, smartphone or smart TV. Enables remote access to Operator Screens, Dashboards, Live Screens and Shop Floor Screens. Data is updated in real-time without any browser-reloading and all clients can be updated from a central point. Supports both a bright and dark theme.
Machine port configuration and management is handled by our powerful DNC communications software CIMCO DNC-Max which also provides features such as advanced program transfers, Remote Request, dynamic feedrate and spindle speed adjustment, auto-receive, parameter offsets and much more.
AUTOMATIC / MANUAL DATA COLLECTION
Accurate data from machines is collected automatically and unattended by MDC-Max. Most installations will, as a minimum, collect data on Cycle Start, Cycle Stop, and Part Complete. The number of data collection events can be expanded as required and is only limited by the monitoring capabilities of each specific machine.
For manual data collection, MDC-Max provides a streamlined interface for mobile and PC where operators can view essential information and enter data manually. Operators can easily register the exact reasons for machine downtime such as Waiting for Setup, Waiting for Maintenance, Scrapped Part, Inspection and more. MDC-Max also comes with full support for barcode readers.
MDC-Max can be configured to collect data on any event limited only by machine capabilities.
REAL-TIME MONITORING / DIGITAL SIGNAGE
Dashboards provide an overview of your real-time production data and KPIs (such as OEE) at a glance. Create multiple custom Dashboards to focus on different production facilities, different machine groups or other requirements you may have. Dashboards can be displayed on large TV monitors as digital signage or on any mobile device using the MDC-Max Web Client.
Live Screens provide a real-time overview of the state of each machine along with information such as OEE, current job, operator/shift, parts produced/scrapped and cycle time. Machines are listed top to bottom with dedicated colors that clearly indicate the state of each machine. Colors can be set to flash on critical states and smaller notification/alert lights can be displayed by each machine. Live Screens are entirely customizable and can be displayed on large TV monitors as digital signage or on any mobile device using the MDC-Max Web Client.
Shop Floor Screens provide a bird’s eye view of your entire shop floor and enable you to see the status of all your machines based on where they are located. The color of machines change based on their state and smaller notification/alert lights can be displayed by each machine. Select any machine to get detailed information such as KPIs (OEE), current operator/job and other relevant information. Shop Floor Screens can be displayed on large TV monitors as digital signage and can be viewed and customized on any tablet or smartphone using the MDC-Max Web Client. Easily move, scale, rotate and change the appearance of machines.
Create Slideshows of your Dashboards, Live Screens and Shop Floor Screens. Slideshows automatically scrolls to reveal the entire content of every screen and, if needed, can be paused and resumed. Slideshows can be displayed on large TV monitors as digital signage or on any mobile device using the MDC-Max Web Client.
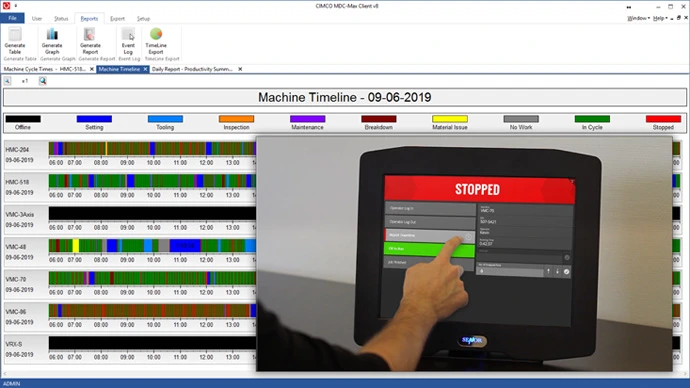
Real-time monitoring using Timeline charts enables you to easily monitor the current and past state of all your machines. Each machine state and downtime reason is visualized with different bar colors and can be expanded to reveal additional information.
Set up real-time reports in the MDC-Max PC client that are dynamically updated, on screen, as incomming data is processed. The MDC-Max PC Client supports having many reports open and updating in different tabs simultaneously. The flexible reporting system in MDC-Max is designed to support a wide variety of custom reports that meet the requirements of any operation.
ANDON / NOTIFICATIONS
MDC-Max comes with support for controlling Tower Stack lights, Beacons, sound alarms and other types of signaling units that are used for visual and audible feedback of machine state. Incomming machine and operator events can be configured to activate colors on a stack light or trigger a sound alarm. A group of machines can even share a signaling unit such as a stack light.
MDC-Max can dispatch text and email notifications to key personnel on any event from both machines and operators. If a machine falls behind or a machine stops while running unattended, such as at night as part of Lights-out Manufacturing initiatives, MDC-Max can automatically notify the right person to take immediate action.
DOWNTIME TRACKING / OPERATOR FEEDBACK
MDC-Max provides a streamlined interface (also referred to as the Operator Screen) for operators to view essential information and enter data manually such as downtime reasons, current job/operator/shift, scrap reasons and more. The operator interface is entirely customizable, easy to understand and designed to be used on the shop floor where it can be operated from any touch-enabled mobile device (tablet/smartphone) or PC. Use-cases such as having a tablet mounted at every machine or managing multiple machine-specific operator interfaces from a single mobile device are fully supported.
MDC-Max supports barcode readers and comes with easy instructions for configuring and printing new barcodes. Similar to Operator Screens, barcodes can be used to send data to MDC-Max such as current job, operator, shift, scrapped parts or provide downtime reasons. Using barcode readers with MDC-Max is mostly relevant if your company already has readers available. Otherwise, we recommend using Operator Screens which provide more options and flexibility.
MDC-Max supports and unlimited number of downtime reasons to meet the requirements of any operation. Downtime reasons can be sent using the Operator Screen or using a Barcode Reader.
MDC-Max comes with dedicated options for configuring how both Job and Program numbers are managed and can automatically associate the event data it receives, from machines and operators, to the job currently running on each machine. This enables MDC-Max to provide accurate statistics about every job on every machine.
REPORTING / KPI / OEE
Both real-time and historic reports can be generated with the MDC-Max PC Client. Real-time reports are dynamically updated on screen as incomming data is processed, while historic reports use existing data to aggregate longer time periods such as a week, month or year. Thanks to its modern tabbed interface, the MDC-Max PC Client supports having multiple reports open and updating simultaneously.
MDC-Max includes a large number of predefined reports that cover most basic reporting needs and which can serve as templates for further customization.
The flexible reporting system in MDC-Max is designed to support a wide variety of custom reports to meet the requirements of any operation. Visualize data in tables, pie or bar charts, add in production targets, work shifts and calculate any KPI, based on user-defined formulas, such as OEE, MTBF, MTTR, and more.
Examples of reports:
- Overall Equipment Effectiveness (OEE)
- Cycle time per part (min, max and average)
- Number of parts per shift/operator
- Number of defective/scrapped parts
- Machine downtime
- Scheduled maintenance
- Unscheduled maintenance
- Setup time per part
- Machine Operator Efficiency
- Mean time between failures (MTBF)
- Mean time to repair (MTTR)
Generate detailed activity reports such as error logs, operator logs and machine logs.
CIMCO MDC-Max comes with full support for Microsoft Excel spreadsheets. Reports can be easily exported for further analysis in Excel and MDC-Max can even update your Excel spreadsheet automatically, so the latest data is always available.
Reports can be automatically exported to Excel, XML, or other format and sent via email.
With our advanced Excel reports, data from MDC-Max can be pulled directly into Excel. This enables anyone in your organisation, with the right permissions, to generate reports directly in Excel.
SECURITY / USER MANAGEMENT
The secure and robust user/group management system in MDC-Max enables fine-grained control over user access and permissions. The MDC-Max clients, database configuration and Operator Screen cannot be accessed without appropriate permissions.
MDC-Max stores detailed logs of all incomming and outgoing events including error logs, operator logs and machine logs. Logs can be stored permanently or rotated (restarted) on a daily, weekly or monthly basis. Logs can also be exported to an external database (which other systems might have access to) or directly to an Excel spreadsheet.
NETWORK SUPPORT / MACHINE CONNECTIONS
MDC-Max can be integrated with your existing network and supports a variety of hardware options including serial wiring, Ethernet and wireless networking. MDC-Max collects data from equipment on your network either directly (if a data collection interfaces is available) or indirectly using additional hardware to establish the connection. The data collection method depends on the specific type of equipment and its monitoring capabilities.
MDC-Max comes with specialized messaging protocols for communicating directly with a wide variety of network based machines/interfaces including Fanuc FOCAS, Haas M-Net, MTConnect, Heidenhain, Netlink, Brother, OPC, Modbus and more.
MDC-Max can be configured to extract messages from incoming DPRNT commands, sent from a machine’s serial communications port.
INTEGRATION WITH EXTERNAL SYSTEMS / ERP / MES
MDC-Max can be configured to automaticaly read/write/update data in multiple data sources including external databases, communication with Web Services and XML file export. When and how data is exchanged can be associated with specific events and user-defined conditions. This allows for integration with external systems such as a company’s ERP and MES systems.
If required, external systems can access (read/write/update) date in the MDC-Max database directly using the ODBC protocol.
For custom integration with external systems and automation of processes, CIMCO provides a C++ library called OEM Link (.dll) which can be customized by the customer. The OEM Link is controlled by the MDC-Max Server and can be programmed to “catch” events from operators and machines as they are received by MDC-Max. This enables the customer to run custom code whenever specific events occur such as calling a Web Service, exporting data to a specific file format or communicate with external APIs.
BROCHURES
MDC-MAX Overview
English